df = pd.read_csv("../data/mmpcurve.csv")
mmp = MMP(df['Secs'], df['Watts'])MMP
Utilities to manipulate power duration curves, fit them and do what-if analysis
The power_curve function will be fitted to its parameters, with reasonable bounds
MMP
MMP (x, y)
A Mean Max Power curve
| Details | |
|---|---|
| x | Time |
| y | Power |
Load a mean maximal curve, with time in seconds and corresponding watts
@patch
def newBest(self:MMP, secs, watts):
    newbest = (self.x<=secs) & (self.y<watts)
self.y.loc[newbest] = wattsplt.figure(figsize=(10,6))
plt.plot(mmp.x, mmp.y)
plt.xscale('log')
plt.show()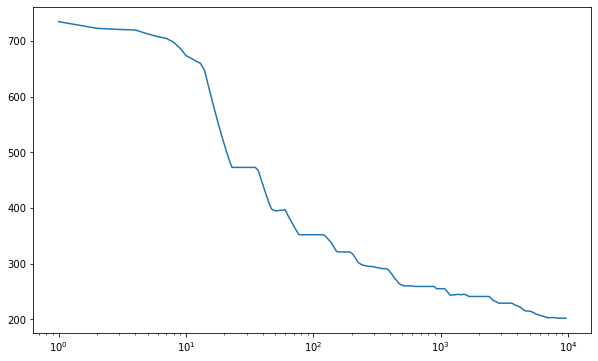
mmp.newBest(100, 400)plt.figure(figsize=(10,6))
plt.plot(mmp.x, mmp.y)
plt.xscale('log')
plt.show()