df = pd.read_csv("../data/mmpcurve.csv")
pdc = PDC(df['Secs'], df['Watts'])PDC
Utilities to manipulate power duration curves, fit them and do what-if analysis
The power_curve function will be fitted to its parameters, with reasonable bounds
power_curve
power_curve (x, frc, ftp, tte, tau, tau2, a)
| Details | |
|---|---|
| x | |
| frc | Functional Reserve Capacity |
| ftp | Functional Threshold Power |
| tte | Time to Exhaustion |
| tau | Short end calibration |
| tau2 | Long end calibration |
| a | Decay factor past TTE |
PDC
PDC (x, y)
A Power Duraction Curve
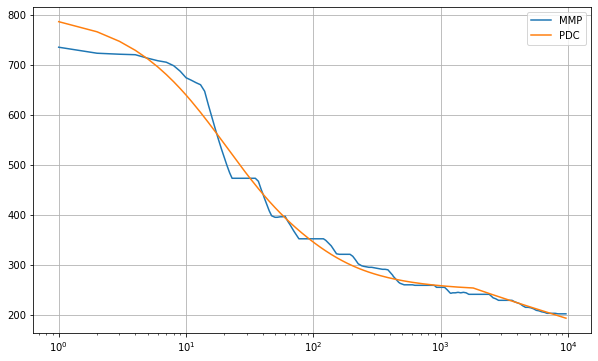
Load a mean maximal curve, with time in seconds and corresponding watts
result = pdc.fit()result.best_values{'frc': 10190.691792353007,
'ftp': 247.97104270072407,
'tte': 1800.0000561443576,
'tau': 12.619522854826833,
'tau2': 25.0,
'a': 33.22731702525135}fitted_curve = power_curve(pdc.x, result.best_values['frc'],
result.best_values['ftp'],
result.best_values['tte'],
result.best_values['tau'],
result.best_values['tau2'],
result.best_values['a'])plt.figure(figsize=(10,6))
plt.plot(pdc.x, pdc.y, label='MMP')
plt.plot(pdc.x, fitted_curve, label='PDC')
plt.legend()
plt.grid(True)
plt.xscale('log')
plt.show()